Data released yesterday shows wedding bells are growing ever-fainter in states across America. This decline in marriage can be seen in the data even before any potential impact of the coronavirus, which is expected to lower the numbers even further due to social distancing-related delays.
According to the latest data from the National Center for Health Statistics, marriage rates hit an all-time low in 2018, the most recently recorded year. The national marriage rate fell from 6.9 to 6.5 marriages per 1,000 people from 2017 to 2018. The dip was the first noticeable change in a fairly-stable trend over the past decade, following a long decline starting in the mid-1980s. As recently as 2001, the national rate was 8.2 marriages per 1,000 people.
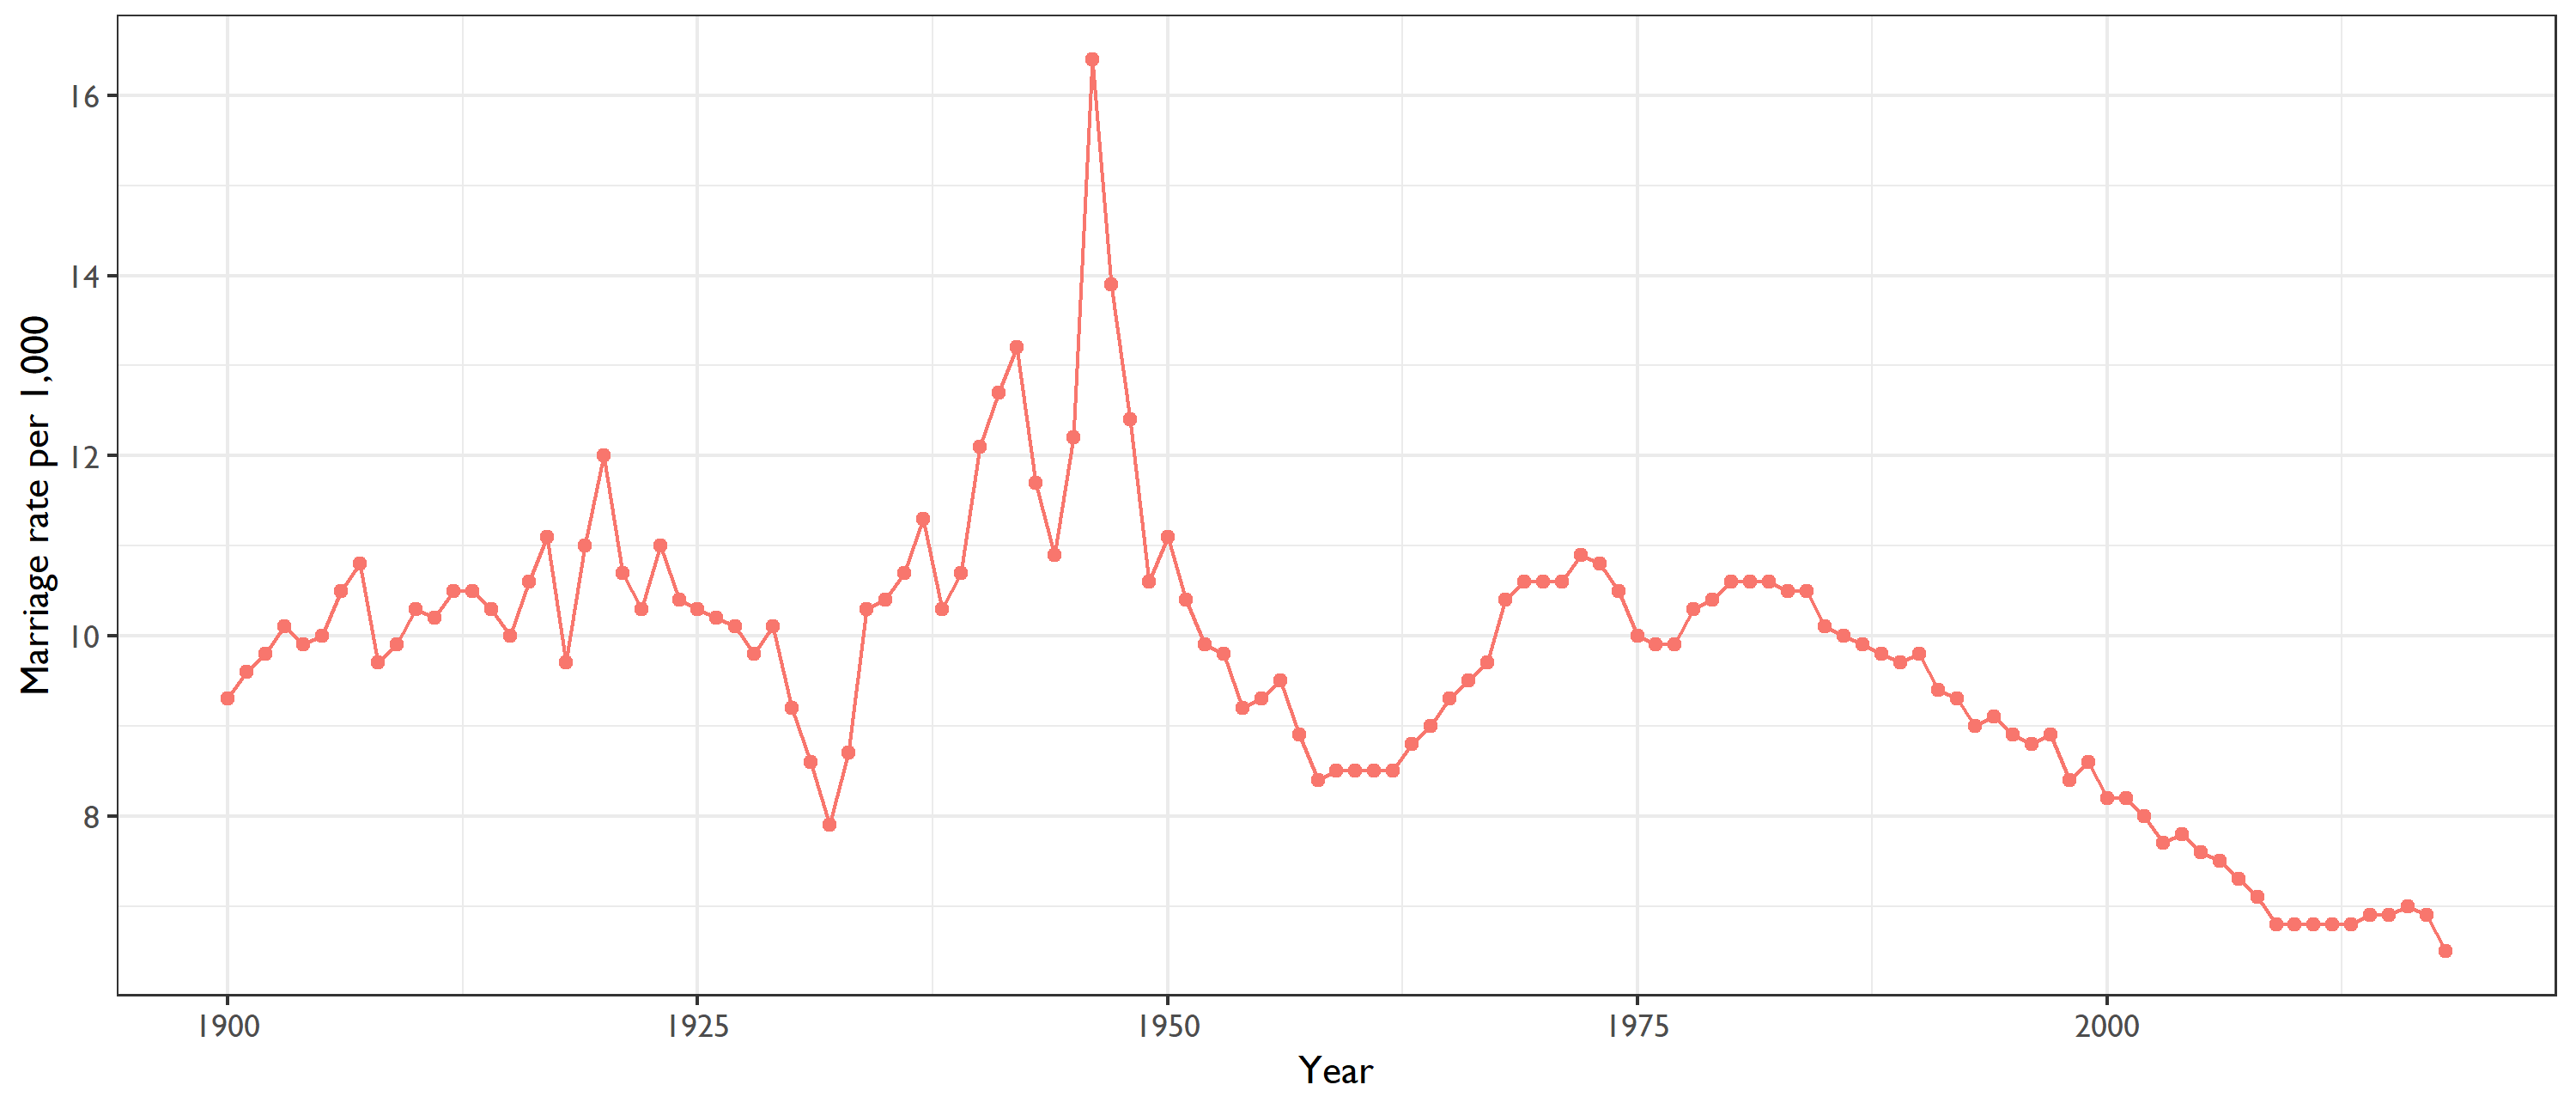
United States marriage rate, 1900-2018
Rate per 1,000 population
Source: CDC/NCHS, National Vital Statistics System.
Marriage is an intensely personal decision, but also has economic and social dimensions. The dramatic high point in the marriage rate followed the end of World War II, while the Great Depression caused a notable decline in the early 1930s. More recently, reviewing marriage trends by region shows that states that previously had higher rates of marriage, including those in the West and South, have converged to the lower levels which have been normal for decades in the Northeast.
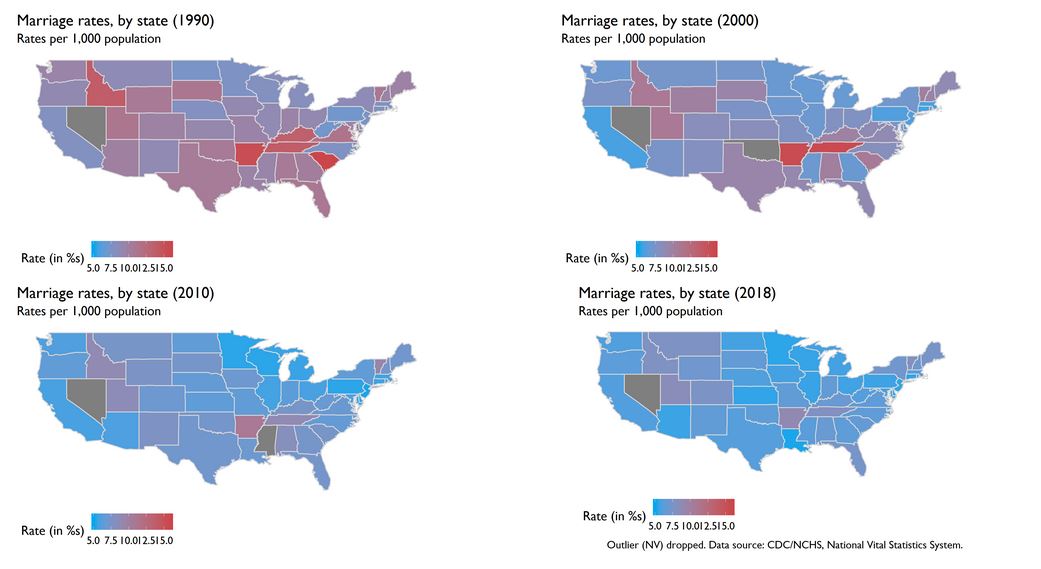
Marriage rates by region (1900, 1995, 1999-2018)
Per 1,000 population
Outliers (NV, HI) suppressed. Source: CDC/NCHS, National Vital Statistics System.
A heat map, showing the prevalence of marriage per 1,000 people, shows this convergence over time (in this figure as well as most others, Nevada and Hawaii are outliers due to the high numbers of weddings in those states and so are suppressed.)
Over the past two decades, state-level data has shown near-universal declines in marriage rates. However, a few states saw a modest increase, possibly driven by the legalization of same-sex marriage, notably Massachusetts, California, and Montana. The District of Columbia saw the highest rise, with a 60% increase in weddings over that timeframe.
Marriage rates by region (1900, 1995, 1999-2018)
Per 1,000 population
Outliers (NV, HI) suppressed. Source: CDC/NCHS, National Vital Statistics System.
Over the past 18 years, the national marriage rate has fallen by about 20 percent, with the decline concentrated among states in the South. At the same time, the divorce rate fell by about 30 percent nationally, possibly a result of self-selection out of marriage by lower-educated or low-income individuals and fewer marriages occurring in the first place. States with the smallest declines in divorce were predominantly located in the northeast, while some states in the South saw divorce rates fall by a third.
Change in marriage rates by state, 2000 to 2018
Rates per 1,000 residents
Dashed line is national average (-20.8%). Source: CDC/NCHS, National Vital Statistics System.
Change in divorce rates by state, 2000 to 2018
Rates per 1,000 residents
Dashed line is national average (-28.8%). Source: CDC/NCHS, National Vital Statistics System.
There may be some compositional effects at work – as the U.S. population ages, more people move out of what we might consider “prime age” for marriage. Since 2005, the fraction of the U.S. population between the ages of 18 and 54 as a share of the total population has fallen from 52.1 to 48.6 percent. If we control for that dynamic, we can see that some – but not all – of the recent decline in marriage is attributable to demographic factors. (The green dashed line shows the rate of marriage among the age group we’ve defined, while the blue dotted line shows what the marriage rate would be if the U.S. still had the age profile it did in 2005.) There was even an increase in the adjusted marriage rate, controlling for demographic shifts, from 2009 to 2016. But drop in recent years is noticeable across the board, no matter the analysis.
United States marriage rate (2005-2018)
Rates per 1,000 population, per 1,000 adults age 18 to 54, and with 2005 population base
Source: ACS 1-year estimates; CDC/NCHS, National Vital Statistics System.
While marriage rates have declined for everyone, past Social Capital Project research illustrates that rates have particularly declined among minorities and those in middle and lower economic quintiles. Decreased marriage is associated with increases in unwed childbearing over the last several decades, particularly for these groups.
One of the goals of the Social Capital Project is straightforward: “We want more children in happy married-parent families.” This goal is potentially made more difficult as marriage becomes rarer and more selective. Recognizing the social and economic barriers that cause more couples to put off marriage should be a priority for policymakers, and the SCP will continue to study these trends in detail.
Patrick T. Brown, senior policy advisor, with assistance from Rachel Sheffield, senior policy advisor.
Permalink:
https://www.jec.senate.gov/public/index.cfm/republicans/2020/4/marriage-rate-blog-test